EMA Indicator ( Exponential Moving Average )
Overview of Exponential Moving Average (EMA) Indicator
The Exponential Moving Average (EMA) is a type of moving average that places a greater weight and significance on the most recent data points. This feature makes the EMA respond more quickly to recent price changes compared to the Simple Moving Average (SMA), which applies equal weight to all observations in the period. The EMA is widely used in technical analysis of financial markets to smooth out price data and identify trends.
Formula and Calculation
The EMA formula is given by:
EMAt = (2 / (N + 1)) × (Pt - EMAt-1) + EMAt-1
Where:
- EMAt is the Exponential Moving Average at time period t
- Pt is the price at time period t
- N is the number of periods
- EMAt-1 is the Exponential Moving Average at the previous time period t-1
Initial EMA Calculation
The calculation of the initial EMA (first value) is based on the Simple Moving Average (SMA):
EMAinitial = (∑i=1N Pi) / N
Where:
- ∑i=1N Pi is the sum of the prices over the past N periods
- N is the number of periods
Example Calculation
Let's calculate a 10-day EMA for a stock using the following price data:
| Day | Price ($Pt$) |
|---|---|
| 1 | 22 |
| 2 | 24 |
| 3 | 26 |
| 4 | 23 |
| 5 | 25 |
| 6 | 28 |
| 7 | 27 |
| 8 | 29 |
| 9 | 30 |
| 10 | 32 |
- Calculate the Initial EMA (SMA for the first 10 days):
- Calculate the Multiplier:
- Calculate the EMA for Day 11:
EMAinitial = (22 + 24 + 26 + 23 + 25 + 28 + 27 + 29 + 30 + 32) / 10 = 26.6
Multiplier = 2 / (N + 1) = 2 / 11 ≈ 0.1818
Assume the price on Day 11 is $31.
EMA11 = (31 - 26.6) × 0.1818 + 26.6 = 27.3992
Application and Interpretation
The EMA is used in various trading strategies to identify trends, generate buy and sell signals, and smooth out price data.
Trend Identification with EMA
EMA Plotting and Trend Visualization
The EMA is plotted along with price data on a chart to visualize the trend. When the price is above the EMA, it indicates an uptrend. Conversely, when the price is below the EMA, it indicates a downtrend. The slope of the EMA can also indicate the strength of the trend.
Buy and Sell Signals
Crossover Strategy and Price Crossover Strategy with EMA
Crossover Strategy
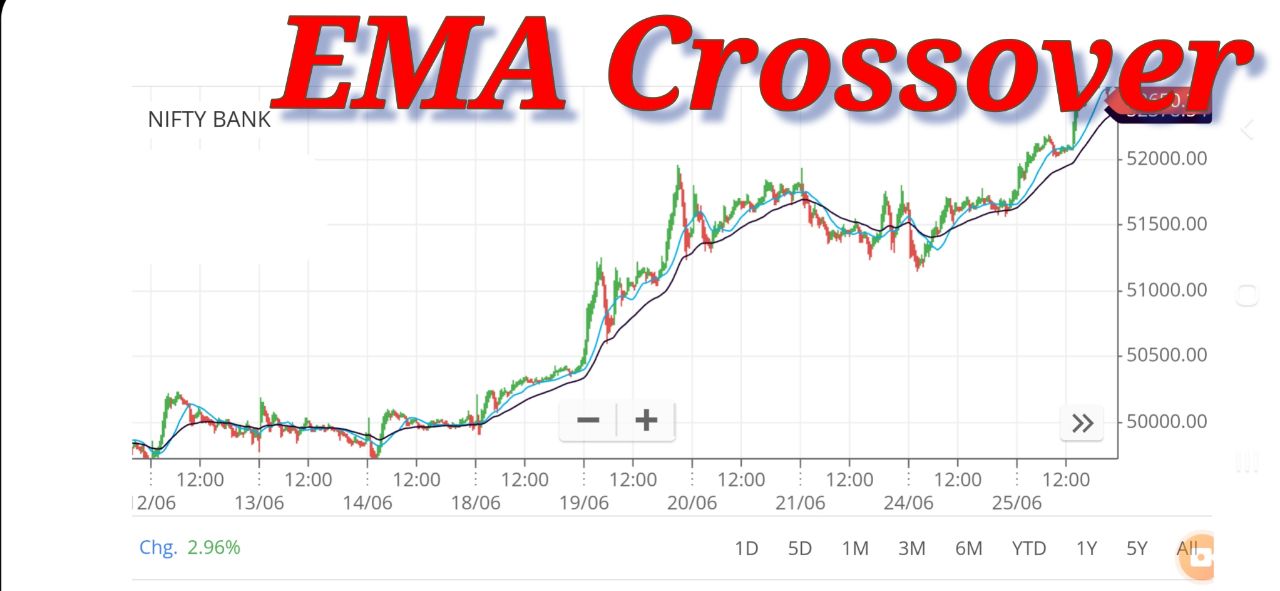
The Crossover Strategy involves using two EMAs with different periods to generate buy and sell signals based on their crossing over each other.
Components:
- Short-term EMA: This is typically a faster EMA, calculated over a shorter period (e.g., 20-day EMA).
- Long-term EMA: This is a slower EMA, calculated over a longer period (e.g., 50-day EMA).
Buy Signal:
A Buy Signal is generated when the short-term EMA crosses above the long-term EMA. This suggests a strengthening trend where recent prices are increasing faster than older prices, indicating potential bullish momentum.
Sell Signal:
A Sell Signal occurs when the short-term EMA crosses below the long-term EMA. This suggests a weakening trend where recent prices are declining faster than older prices, suggesting potential bearish momentum.
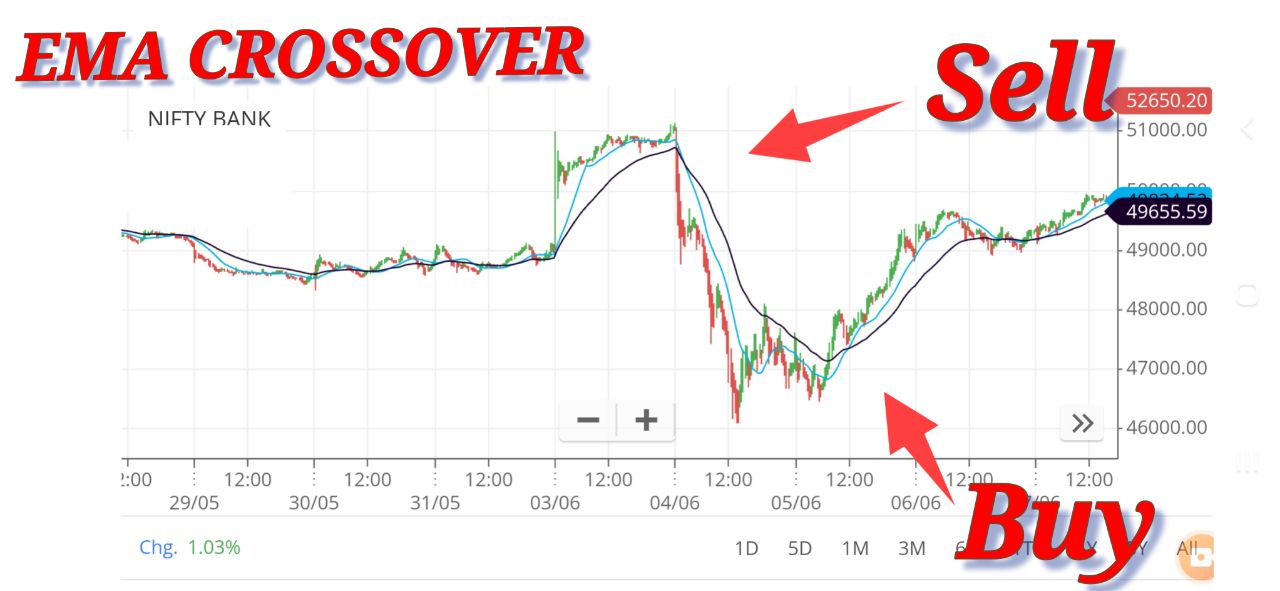
Interpretation:
Traders use these signals to enter or exit positions, aiming to capitalize on trends. The crossover strategy helps in identifying shifts in market sentiment and momentum.
Price Crossover Strategy
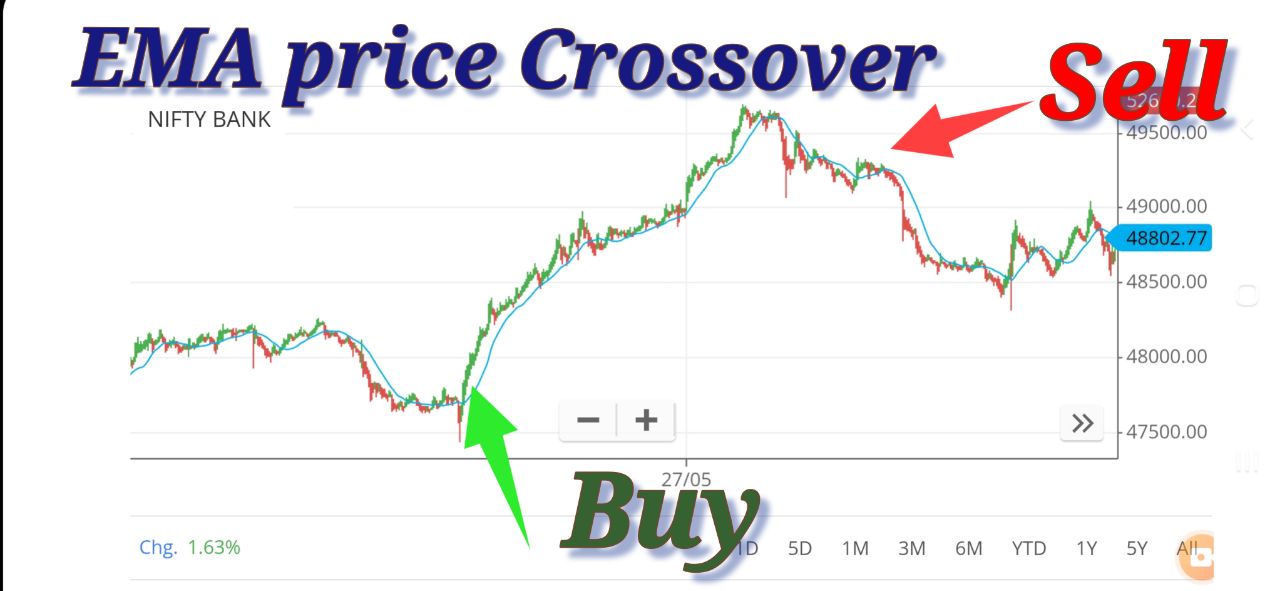
The Price Crossover Strategy involves using the EMA crossover with the price itself to generate buy and sell signals.
Components:
- EMA (typically short-term): Calculated over a specific period (e.g., 20-day EMA).
- Price: The current market price of the asset being analyzed.
Buy Signal:
A Buy Signal occurs when the price crosses above the EMA. This suggests that the current market price has risen above the smoothed average price, indicating potential upward momentum.
Sell Signal:
A Sell Signal is generated when the price crosses below the EMA. This suggests that the current market price has fallen below the smoothed average price, suggesting potential downward momentum.
Interpretation:
The price crossover strategy helps traders to confirm trends observed through the EMA and price movements. It provides additional confirmation before making trading decisions based on price movements relative to the EMA.
Example:
Let's consider a stock where we have calculated both a 20-day EMA and a 50-day EMA. Here are the scenarios:
- Scenario 1 (Crossover Strategy):
The 20-day EMA crosses above the 50-day EMA.
Signal: Buy Signal. This indicates potential bullish momentum as recent prices are rising faster than older prices. - Scenario 2 (Crossover Strategy):
The 20-day EMA crosses below the 50-day EMA.
Signal: Sell Signal. This suggests potential bearish momentum as recent prices are declining faster than older prices. - Scenario 3 (Price Crossover Strategy):
The market price of the stock crosses above the 20-day EMA.
Signal: Buy Signal. This indicates that the current price has surpassed the smoothed average, suggesting potential upward momentum. - Scenario 4 (Price Crossover Strategy):
The market price of the stock crosses below the 20-day EMA.
Signal: Sell Signal. This indicates that the current price has fallen below the smoothed average, suggesting potential downward momentum.
The Crossover Strategy and Price Crossover Strategy are popular techniques used by traders to identify trends and potential trading opportunities using EMAs. These strategies provide clear signals based on the relationship between short-term and long-term EMAs or between price and EMAs, helping traders make informed decisions in dynamic market conditions.
Stop-Loss in Price Crossover Strategy and Crossover Strategy
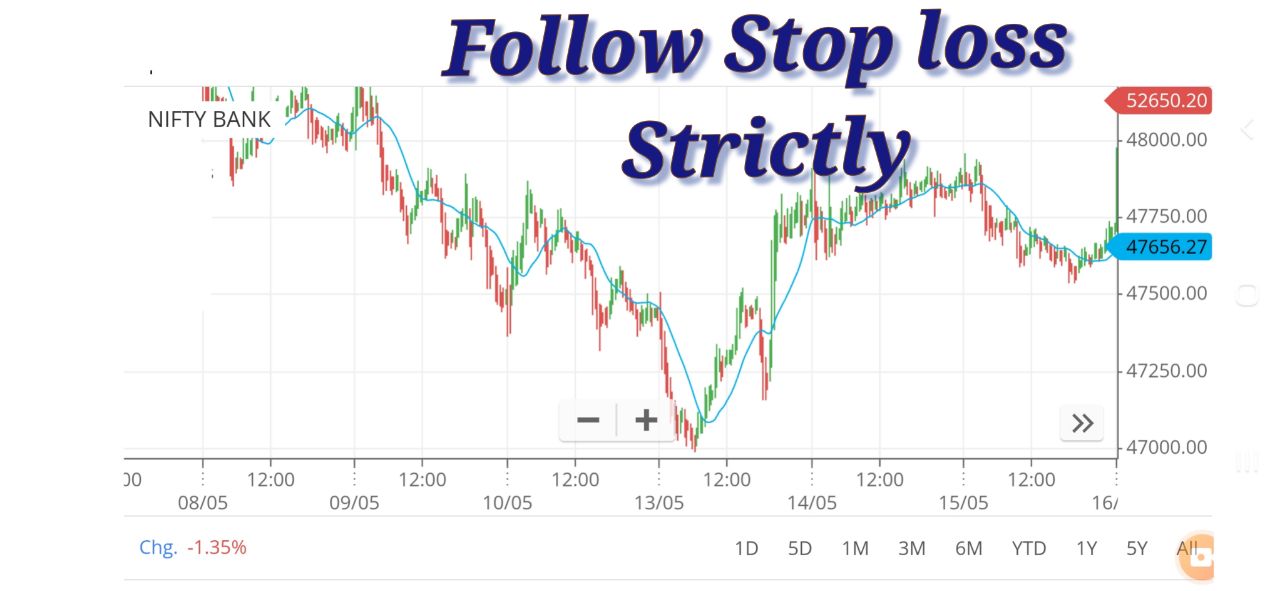
In trading, using a stop-loss order is crucial for managing risk. A stop-loss order is an instruction to sell a security when it reaches a certain price, limiting the trader's potential loss on a position. Implementing stop-losses effectively in both the Price Crossover Strategy and the Crossover Strategy can help protect against significant losses.
Price Crossover Strategy
In the Price Crossover Strategy, the stop-loss can be set based on a variety of methods, including a fixed percentage, support levels, or ATR (Average True Range). Here's how you can set a stop-loss:
1. Fixed Percentage Stop-Loss
- Buy Signal: When the price crosses above the EMA.
- Stop-Loss: Set a stop-loss at a fixed percentage below the entry price (e.g., 2% below the entry price).
- Sell Signal: When the price crosses below the EMA.
- Stop-Loss: Set a stop-loss at a fixed percentage above the entry price (for short positions).
2. Support Level Stop-Loss
- Buy Signal: When the price crosses above the EMA.
- Stop-Loss: Set a stop-loss just below the nearest support level. Support levels are previous lows where the price has tended to stop falling and bounce back up.
- Sell Signal: When the price crosses below the EMA.
- Stop-Loss: Set a stop-loss just above the nearest resistance level. Resistance levels are previous highs where the price has tended to stop rising and fall back down.
3. ATR (Average True Range) Stop-Loss
- Buy Signal: When the price crosses above the EMA.
- Stop-Loss: Use the ATR to set a stop-loss at a certain multiple below the entry price (e.g., 1.5 times the ATR below the entry price).
- Sell Signal: When the price crosses below the EMA.
- Stop-Loss: Use the ATR to set a stop-loss at a certain multiple above the entry price for short positions.
Crossover Strategy
In the Crossover Strategy, where a short-term EMA crosses over a long-term EMA to generate signals, the stop-loss can also be set using similar methods:
1. Fixed Percentage Stop-Loss
- Buy Signal: When the short-term EMA crosses above the long-term EMA.
- Stop-Loss: Set a stop-loss at a fixed percentage below the entry price.
- Sell Signal: When the short-term EMA crosses below the long-term EMA.
- Stop-Loss: Set a stop-loss at a fixed percentage above the entry price for short positions.
2. Support Level Stop-Loss
- Buy Signal: When the short-term EMA crosses above the long-term EMA.
- Stop-Loss: Set a stop-loss just below the nearest support level.
- Sell Signal: When the short-term EMA crosses below the long-term EMA.
- Stop-Loss: Set a stop-loss just above the nearest resistance level.
3. ATR Stop-Loss
- Buy Signal: When the short-term EMA crosses above the long-term EMA.
- Stop-Loss: Use the ATR to set a stop-loss at a certain multiple below the entry price.
- Sell Signal: When the short-term EMA crosses below the long-term EMA.
- Stop-Loss: Use the ATR to set a stop-loss at a certain multiple above the entry price for short positions.
Example of Implementing Stop-Losses
Let's consider a stock with the following scenarios:
Price Crossover Strategy Example
- Buy Signal: The stock price crosses above the 20-day EMA at $50.
- Fixed Percentage Stop-Loss: Set at 2% below $50, i.e., $49.
- Support Level Stop-Loss: Identify the nearest support level at $48.50 and set the stop-loss just below it, e.g., $48.45.
- ATR Stop-Loss: If the ATR is $1, set the stop-loss at 1.5 times ATR below $50, i.e., $48.50.
- Sell Signal: The stock price crosses below the 20-day EMA at $50.
- Fixed Percentage Stop-Loss: Set at 2% above $50, i.e., $51.
- Resistance Level Stop-Loss: Identify the nearest resistance level at $51.50 and set the stop-loss just above it, e.g., $51.55.
- ATR Stop-Loss: If the ATR is $1, set the stop-loss at 1.5 times ATR above $50, i.e., $51.50.
Crossover Strategy Example
- Buy Signal: The 20-day EMA crosses above the 50-day EMA at $50.
- Fixed Percentage Stop-Loss: Set at 2% below $50, i.e., $49.
- Support Level Stop-Loss: Identify the nearest support level at $48.50 and set the stop-loss just below it, e.g., $48.45.
- ATR Stop-Loss: If the ATR is $1, set the stop-loss at 1.5 times ATR below $50, i.e., $48.50.
- Sell Signal: The 20-day EMA crosses below the 50-day EMA at $50.
- Fixed Percentage Stop-Loss: Set at 2% above $50, i.e., $51.
- Resistance Level Stop-Loss: Identify the nearest resistance level at $51.50 and set the stop-loss just above it, e.g., $51.55.
- ATR Stop-Loss: If the ATR is $1, set the stop-loss at 1.5 times ATR above $50, i.e., $51.50.
Using stop-losses in both the Price Crossover Strategy and the Crossover Strategy is essential for effective risk management. By setting stop-losses at appropriate levels, traders can protect their capital from significant losses and ensure that their trading strategies remain robust and resilient in different market conditions.
Smoothing Price Data
The EMA helps to smooth out price data and reduce noise, making it easier to spot trends and reversals. This is particularly useful in volatile markets where price movements can be erratic.
Equivalent Formulas and Variations
- Simple Moving Average (SMA): SMAt = (∑i=1N Pt-i+1) / N
- Weighted Moving Average (WMA): WMAt = (∑i=1N (wi × Pt-i+1)) / (∑i=1N wi)
- Double Exponential Moving Average (DEMA): DEMAt = 2 × EMAt - EMA of EMAt
- Triple Exponential Moving Average (TEMA): TEMAt = 3 × EMAt - 3 × EMA of EMAt + EMA of EMA of EMAt
Practical Example with Data
Consider a stock with the following closing prices for 15 days:
| Day | Price ($Pt$) |
|---|---|
| 1 | 20 |
| 2 | 21 |
| 3 | 22 |
| 4 | 23 |
| 5 | 24 |
| 6 | 25 |
| 7 | 26 |
| 8 | 27 |
| 9 | 28 |
| 10 | 29 |
| 11 | 30 |
| 12 | 31 |
| 13 | 32 |
| 14 | 33 |
| 15 | 34 |
- Initial EMA (First 10 days SMA):
- Multiplier:
- Calculate subsequent EMAs:
- Day 11: EMA11 = (30 - 24.5) × 0.1818 + 24.5 = 25.5
- Day 12: EMA12 = (31 - 25.5) × 0.1818 + 25.5 = 26.5
- Day 13: EMA13 = (32 - 26.5) × 0.1818 + 26.5 = 27.5
- Day 14: EMA14 = (33 - 27.5) × 0.1818 + 27.5 = 28.5
- Day 15: EMA15 = (34 - 28.5) × 0.1818 + 28.5 = 29.5
EMAinitial = (20 + 21 + 22 + 23 + 24 + 25 + 26 + 27 + 28 + 29) / 10 = 24.5
Multiplier = 2 / 11 ≈ 0.1818
The Exponential Moving Average (EMA) is a powerful tool in technical analysis, offering a responsive indicator for price trends. Its ability to weight recent prices more heavily than older ones makes it particularly useful in volatile markets. By understanding and applying the EMA, traders can make more informed decisions, enhance their strategies, and potentially improve their trading performance.