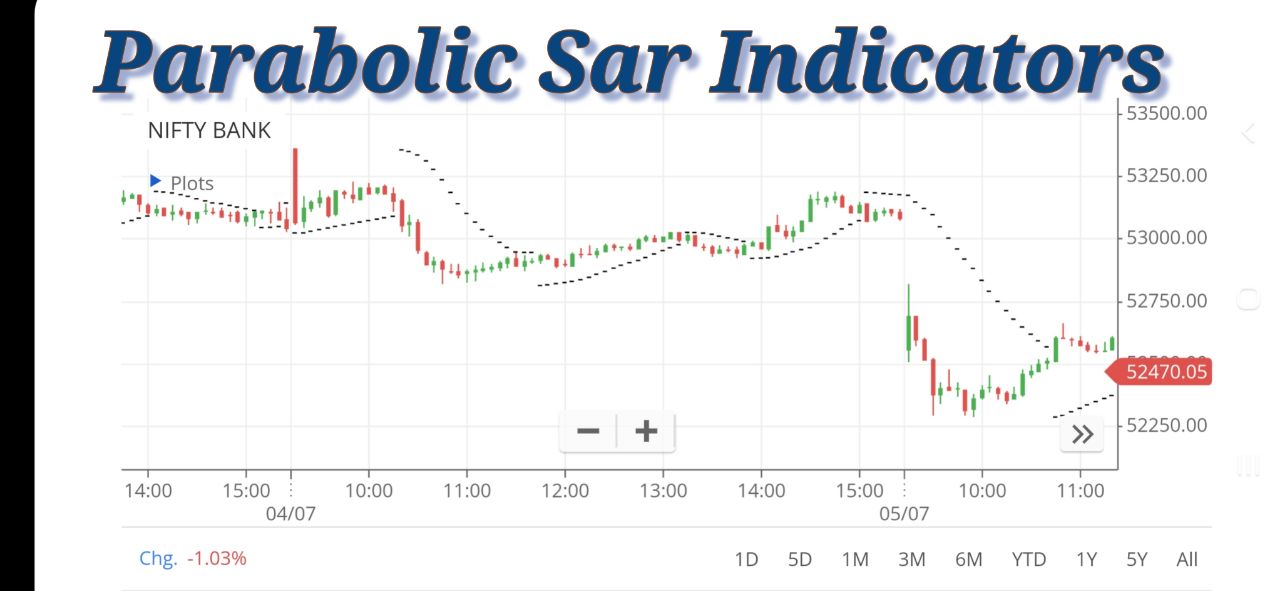
Parabolic SAR Indicator
Technical Analysis: Parabolic SAR Indicator

The Parabolic SAR (Stop and Reverse) indicator is a trend-following indicator used to determine potential reversals in the price direction of an asset. It was developed by J. Welles Wilder Jr., and it helps traders identify where to place stop-loss orders.
Calculation of Parabolic SAR
Uptrend Calculation:
- SAR(t) = SAR(t-1) + α (EP - SAR(t-1))
- SAR(t): Current period's SAR value
- SAR(t-1): Previous period's SAR value
- EP (Extreme Point): The highest high in the current uptrend
- α (Acceleration Factor): Starts at 0.02 and increases by 0.02 with each new high in the trend, up to a maximum of 0.20
Downtrend Calculation:
- SAR(t) = SAR(t-1) - α (SAR(t-1) - EP)
- EP (Extreme Point): The lowest low in the current downtrend
Important Points:
- When the SAR value is below the price, it indicates an uptrend.
- When the SAR value is above the price, it indicates a downtrend.
- The indicator is typically shown as a series of dots placed either above or below the price bars on a chart.
Example Calculation
Consider a hypothetical stock with the following high and low prices over a period of days:
| Day | High Price | Low Price | Closing Price |
|---|---|---|---|
| 1 | 50 | 48 | 49 |
| 2 | 51 | 49 | 50 |
| 3 | 52 | 50 | 51 |
| 4 | 53 | 51 | 52 |
| 5 | 54 | 52 | 53 |
Uptrend Example Calculation:
Assume SAR(0) = 48 (the initial SAR value) and EP = 50 (initial highest high).
α starts at 0.02.
Day 1:
- SAR(1) = SAR(0) + α (EP - SAR(0))
- SAR(1) = 48 + 0.02 (50 - 48) = 48 + 0.02 × 2 = 48 + 0.04 = 48.04
Day 2:
- EP is updated to 51 (since it's higher than the previous EP).
- α is updated to 0.04 (since a new high is reached).
- SAR(2) = SAR(1) + α (EP - SAR(1))
- SAR(2) = 48.04 + 0.04 (51 - 48.04) = 48.04 + 0.04 × 2.96 = 48.04 + 0.1184 = 48.1584
Equivalent Formulas:
Simplified Parabolic SAR:
- SAR(t) = SAR(t-1) + α (EP - SAR(t-1))
Moving Average Convergence Divergence (MACD):
- MACD Line: 12-day EMA - 26-day EMA
- Signal Line: 9-day EMA of MACD Line
Bollinger Bands:
- Middle Band = 20-day SMA
- Upper Band = Middle Band + (2 × 20-day Standard Deviation)
- Lower Band = Middle Band - (2 × 20-day Standard Deviation)
Note - The Parabolic SAR is an effective tool for identifying the direction of an asset's price movement and potential reversal points. By following its calculations, traders can make informed decisions on when to enter or exit trades, place stop-loss orders, and better manage their trading strategy.
Advantages
- Clear Trend Identification: The Parabolic SAR clearly shows the direction of the trend, making it easy for traders to identify whether the market is in an uptrend or downtrend.
- Easy to Use: The indicator is simple to understand and use, with straightforward calculations and visual representations on the price chart.
- Effective in Trending Markets: It performs well in trending markets, providing timely signals for entry and exit points.
- Stop and Reverse Mechanism: The SAR helps traders set stop-loss levels, ensuring risk management and protecting profits by reversing positions when the trend changes.
Disadvantages
- Ineffective in Ranging Markets: The Parabolic SAR can give false signals in a sideways or ranging market, leading to potential losses due to frequent whipsaws.
- Lagging Indicator: As a lagging indicator, it may provide signals after the trend has already begun, causing traders to miss the initial part of the move.
- Fixed Acceleration Factor: The fixed acceleration factor may not suit all assets or market conditions, requiring adjustments for different trading scenarios.
How to Trade Based on the Parabolic SAR Indicator
Identifying the Trend
- When the Parabolic SAR is below the price, it indicates an uptrend. Conversely, when the SAR is above the price, it indicates a downtrend.
Entry Points
- Buy Signal: Enter a long position when the SAR moves below the price, signaling the start of an uptrend.
- Sell Signal: Enter a short position when the SAR moves above the price, signaling the start of a downtrend.
Exit Points
- Exit Long Position: Close the long position when the SAR moves above the price, indicating a potential trend reversal.
- Exit Short Position: Close the short position when the SAR moves below the price, indicating a potential trend reversal.
Setting Stop-Loss
- Place stop-loss orders at the SAR level to protect against adverse price movements. Adjust the stop-loss level as the SAR value updates with each new period.
Combining with Other Indicators
- Use the Parabolic SAR in conjunction with other indicators like Moving Averages, Relative Strength Index (RSI), or MACD to confirm signals and enhance the accuracy of trading decisions.
Example Strategy
Uptrend Trading
- Enter a long position when the SAR dots appear below the price.
- Set the initial stop-loss at the SAR value.
- Adjust the stop-loss level daily based on the updated SAR value until the SAR dots move above the price, indicating an exit point.
Downtrend Trading
- Enter a short position when the SAR dots appear above the price.
- Set the initial stop-loss at the SAR value.
- Adjust the stop-loss level daily based on the updated SAR value until the SAR dots move below the price, indicating an exit point.
By understanding and utilizing the Parabolic SAR indicator effectively, traders can improve their decision-making process and enhance their trading performance in trending markets.