Moving Average Indicator
Introduction to Moving Averages (MA)
Moving Averages (MA) are statistical measures used in technical analysis to smooth out price data by creating a constantly updated average price. The average is taken over a specific period of time, which can range from minutes to years, depending on the type of moving average and the analysis goals. MAs are essential tools for identifying trends, generating trading signals, and analyzing the direction of market movements.
Types of Moving Averages
- Simple Moving Average (SMA)
- Exponential Moving Average (EMA)
- Weighted Moving Average (WMA)
- Hull Moving Average (HMA)
- Volume-Weighted Moving Average (VWMA)
Simple Moving Average (SMA)
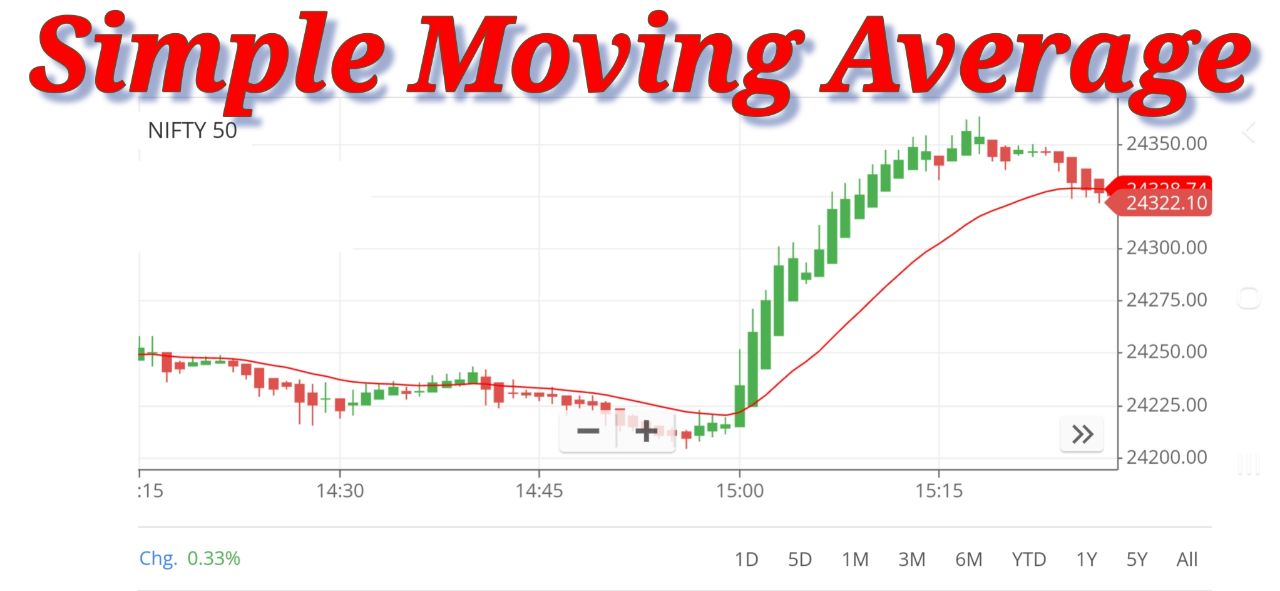
The Simple Moving Average (SMA) is the arithmetic mean of a given set of prices over a specified number of periods. The SMA is calculated by adding the closing prices of the security for a number of time periods and then dividing this total by the number of time periods.
SMA = (P1 + P2 + ... + Pn) / n
Where:
- P1, P2, ..., Pn are the closing prices for each period.
- n is the number of periods.
Consider the closing prices over 5 days: 50, 51, 52, 53, and 54.
SMA = (50 + 51 + 52 + 53 + 54) / 5 = 260 / 5 = 52
Exponential Moving Average (EMA)
The Exponential Moving Average (EMA) gives more weight to recent prices, making it more responsive to new information. The EMA is calculated using a smoothing factor and the previous EMA value.
EMA = Pt * (2 / (n + 1)) + EMAy * (1 - (2 / (n + 1)))
Where:
- Pt is the current price.
- n is the number of periods.
- EMAy is the EMA of the previous period.
Consider a 5-day EMA and closing prices: 50, 51, 52, 53, and 54. Assuming the previous EMA (EMAy) was 52.
EMA = 54 * (2 / (5 + 1)) + 52 * (1 - (2 / (5 + 1)))
EMA = 54 * 0.3333 + 52 * 0.6667
EMA = 18 + 34.67 = 52.67
Weighted Moving Average (WMA)
The Weighted Moving Average (WMA) assigns different weights to each data point in the period. Recent data points have higher weights, making WMA more responsive to price changes.
WMA = (n * Pt + (n-1) * Pt-1 + ... + 1 * Pt-(n-1)) / (n + (n-1) + ... + 1)
Where:
- n is the number of periods.
- Pt, Pt-1, ... are the prices of the periods.
Consider a 3-day WMA and closing prices: 50, 51, and 52.
WMA = (3 * 52 + 2 * 51 + 1 * 50) / (3 + 2 + 1)
WMA = (156 + 102 + 50) / 6 = 308 / 6 = 51.33
Hull Moving Average (HMA)
The Hull Moving Average (HMA) aims to reduce lag while improving the smoothing of price data. It is calculated using a combination of Weighted Moving Averages.
HMA = WMA(2 * WMA(n/2) - WMA(n)), √n
Where:
- WMA(n) is the Weighted Moving Average for n periods.
- √n is the square root of the number of periods.
For a 9-period HMA, calculate the WMAs for 4.5 periods and 9 periods, then apply the formula. (Note: rounding may be necessary for half periods.)
Volume-Weighted Moving Average (VWMA)
The Volume-Weighted Moving Average (VWMA) considers both price and volume, giving more weight to prices with higher trading volumes.
VWMA = (sum(Pt * Vt)) / (sum(Vt))
Where:
- Pt is the price of the period.
- Vt is the volume of the period.
Consider prices and volumes over 3 days: (50, 1000), (51, 1200), (52, 1100).
VWMA = (50 * 1000 + 51 * 1200 + 52 * 1100) / (1000 + 1200 + 1100)
VWMA = (50000 + 61200 + 57200) / 3300 = 168400 / 3300 = 51.03
Moving Averages in Technical Analysis
Moving Averages are used to:
- Identify Trends: MAs help in distinguishing between trending and non-trending environments. An upward-sloping MA indicates an uptrend, while a downward-sloping MA suggests a downtrend.
- Generate Trading Signals: Crossovers between different MAs can signal potential buy or sell opportunities. For example, when a short-term MA crosses above a long-term MA, it may indicate a buy signal.
- Support and Resistance Levels: MAs can act as dynamic support and resistance levels, where prices tend to bounce off the MA lines.
Examples and Practical Applications
Example 1: SMA Crossover Strategy
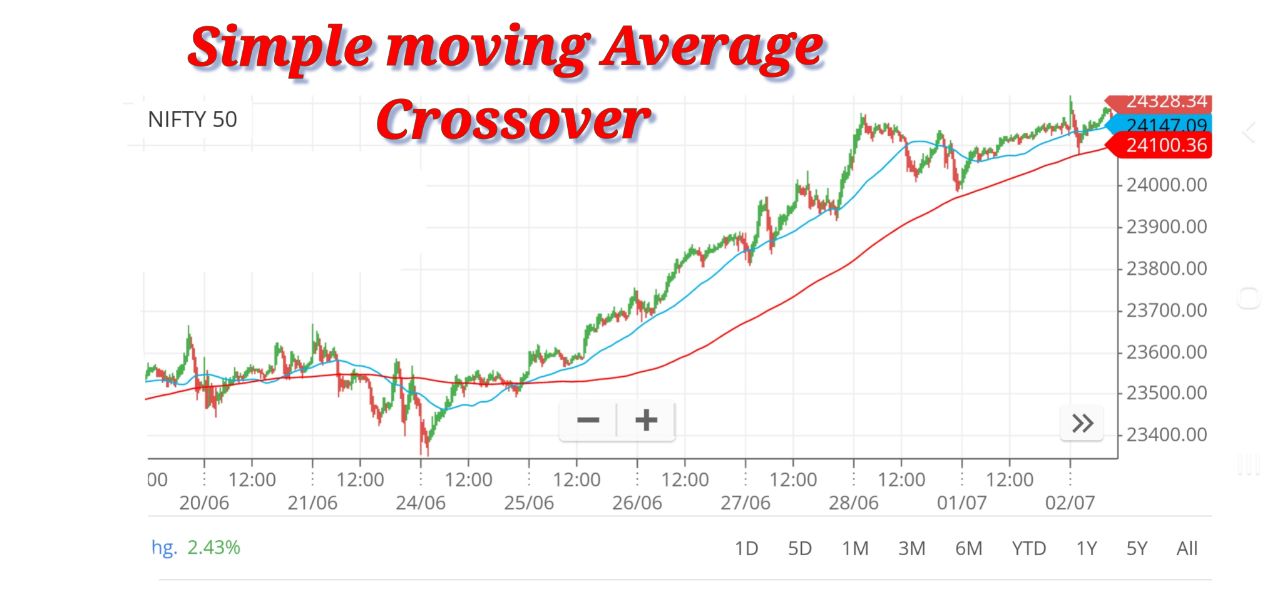
A common strategy involves using a short-term SMA (e.g., 50-day) and a long-term SMA (e.g., 200-day). When the 50-day SMA crosses above the 200-day SMA, it generates a bullish signal (Golden Cross). Conversely, when the 50-day SMA crosses below the 200-day SMA, it generates a bearish signal (Death Cross).
Example 2: EMA in Day Trading
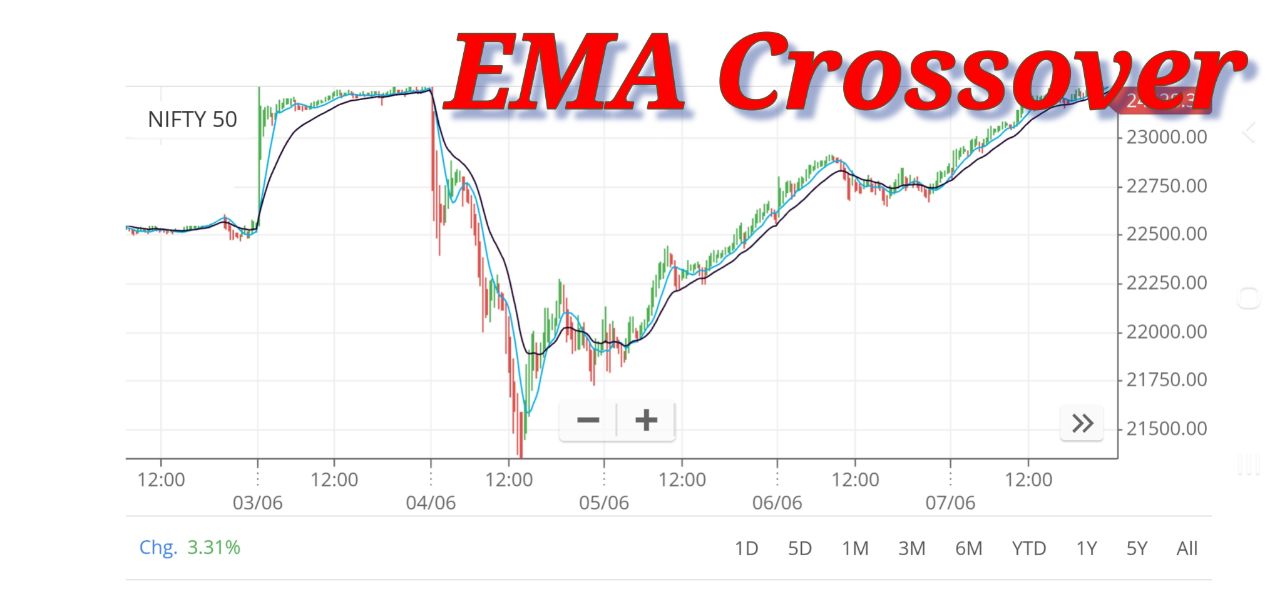
Day traders often use shorter EMAs (e.g., 9-day and 21-day) to capture quick price movements. A crossover of the 9-day EMA above the 21-day EMA can signal a buying opportunity, while the opposite crossover may indicate a selling opportunity.
Stop-Loss in the SMA Crossover Strategy
The Simple Moving Average (SMA) Crossover Strategy is a popular trading method that involves using two SMAs with different periods to generate buy and sell signals based on their crossings. Implementing effective stop-loss orders in this strategy is essential to manage risk and protect against significant losses.
Components of the SMA Crossover Strategy:
- Short-term SMA: A faster SMA calculated over a shorter period (e.g., 20-day SMA).
- Long-term SMA: A slower SMA calculated over a longer period (e.g., 50-day SMA).
Buy and Sell Signals:
- Buy Signal: Generated when the short-term SMA crosses above the long-term SMA.
- Sell Signal: Generated when the short-term SMA crosses below the long-term SMA.
Setting Stop-Loss Orders in the SMA Crossover Strategy
Methods for Setting Stop-Losses:
- Fixed Percentage Stop-Loss
- Support and Resistance Levels
- ATR (Average True Range) Stop-Loss
1. Fixed Percentage Stop-Loss
Buy Signal:
- Entry: When the short-term SMA crosses above the long-term SMA.
- Stop-Loss: Set at a fixed percentage below the entry price (e.g., 2%).
Sell Signal:
- Entry: When the short-term SMA crosses below the long-term SMA.
- Stop-Loss: Set at a fixed percentage above the entry price (for short positions).
Example:
- Buy Signal Entry Price: $50
- Fixed Percentage Stop-Loss: 2% below $50 = $49
- Sell Signal Entry Price: $50
- Fixed Percentage Stop-Loss: 2% above $50 = $51
2. Support and Resistance Levels
Buy Signal:
- Entry: When the short-term SMA crosses above the long-term SMA.
- Stop-Loss: Set just below the nearest support level.
Sell Signal:
- Entry: When the short-term SMA crosses below the long-term SMA.
- Stop-Loss: Set just above the nearest resistance level.
Example:
- Buy Signal Entry Price: $50
- Nearest Support Level: $48.50
- Stop-Loss: Set just below $48.50, e.g., $48.45
- Sell Signal Entry Price: $50
- Nearest Resistance Level: $51.50
- Stop-Loss: Set just above $51.50, e.g., $51.55
3. ATR (Average True Range) Stop-Loss
The ATR is a volatility indicator that measures the average range of price movements over a specified period. Using the ATR to set stop-loss levels helps account for market volatility.
Buy Signal:
- Entry: When the short-term SMA crosses above the long-term SMA.
- Stop-Loss: Use the ATR to set a stop-loss at a certain multiple below the entry price (e.g., 1.5 times the ATR).
Sell Signal:
- Entry: When the short-term SMA crosses below the long-term SMA.
- Stop-Loss: Use the ATR to set a stop-loss at a certain multiple above the entry price (for short positions).
Example:
- Buy Signal Entry Price: $50
- ATR Value: $1
- ATR Stop-Loss: 1.5 times ATR below $50 = $50 - $1.50 = $48.50
- Sell Signal Entry Price: $50
- ATR Value: $1
- ATR Stop-Loss: 1.5 times ATR above $50 = $50 + $1.50 = $51.50
Practical Example
Let's consider a stock where we apply the SMA Crossover Strategy with a 20-day SMA and a 50-day SMA:
Scenario:
Buy Signal:
- Entry: The 20-day SMA crosses above the 50-day SMA at $100.
- Fixed Percentage Stop-Loss: 2% below $100 = $98.
- Support Level Stop-Loss: Nearest support level is at $97, so set the stop-loss just below, e.g., $96.90.
- ATR Stop-Loss: If the ATR is $2, set the stop-loss at 1.5 times ATR below $100 = $100 - $3 = $97.
Sell Signal:
- Entry: The 20-day SMA crosses below the 50-day SMA at $100.
- Fixed Percentage Stop-Loss: 2% above $100 = $102.
- Resistance Level Stop-Loss: Nearest resistance level is at $103, so set the stop-loss just above, e.g., $103.10.
- ATR Stop-Loss: If the ATR is $2, set the stop-loss at 1.5 times ATR above $100 = $100 + $3 = $103.
Conclusion
Implementing stop-loss orders in the SMA Crossover Strategy is essential for effective risk management. By using methods such as fixed percentage, support and resistance levels, and ATR, traders can set appropriate stop-loss levels to protect their capital and minimize losses. This approach ensures that trading strategies remain robust and resilient in different market conditions.
Advantages and Disadvantages
Advantages:
- Trend Identification: MAs smooth out price data, making it easier to identify trends.
- Versatility: Applicable to various timeframes and securities.
- Support and Resistance: Dynamic levels that adjust with price changes.
Disadvantages:
- Lag: MAs are lagging indicators and may not predict future prices.
- Whipsaws: Frequent crossovers in volatile markets can lead to false signals.
- Parameter Sensitivity: The choice of period length significantly affects the MA's responsiveness.
Moving Averages are fundamental tools in technical analysis, providing valuable insights into market trends and potential trading opportunities. By understanding the different types of MAs and their applications, traders can enhance their analysis and improve their decision-making processes. Whether using SMAs, EMAs, WMAs, HMAs, or VWMAs, each moving average offers unique advantages and can be tailored to specific trading strategies and market conditions.