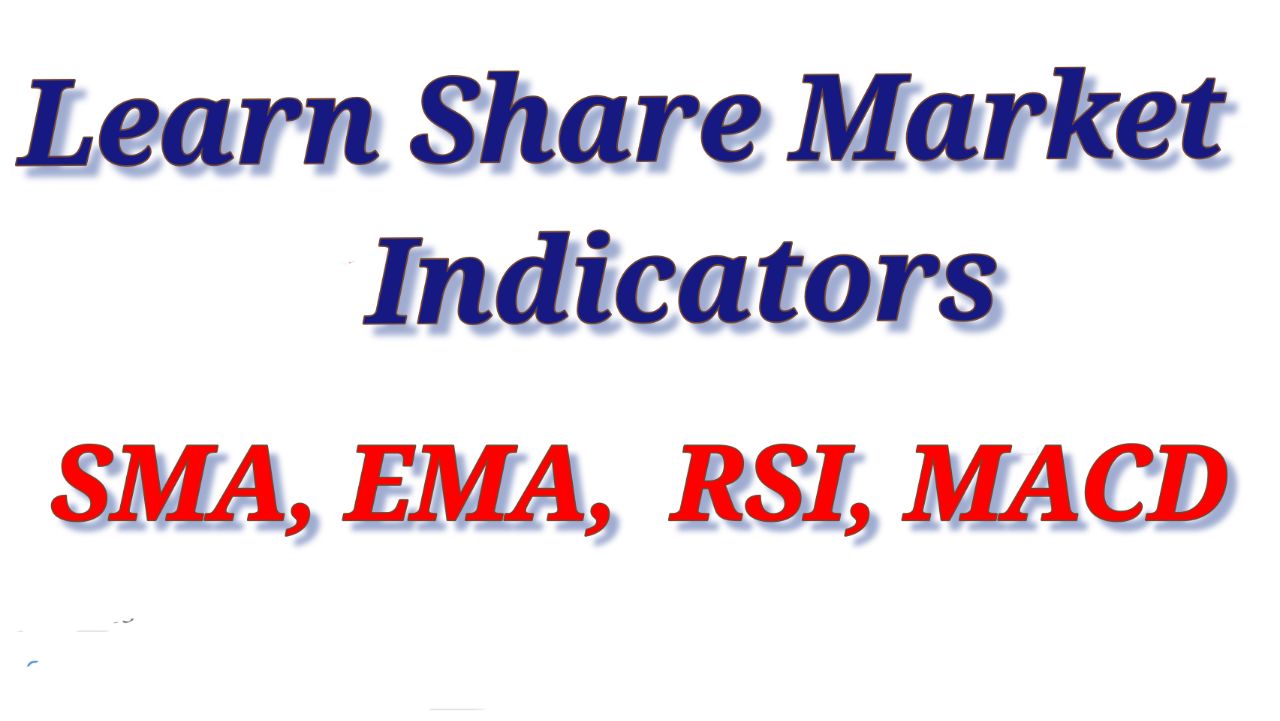
Types of Indicators in the Share Market
Learn about Indicators, what is These ?:-
1. Trend Following Indicators:
- Moving Averages: These indicators smooth out price data over a specified period, helping traders identify trends by filtering out short-term fluctuations.
- MACD (Moving Average Convergence Divergence): MACD uses moving averages to gauge the strength and direction of a trend, along with signals derived from moving average crossovers.
2. Momentum Indicators:
- RSI (Relative Strength Index): RSI measures the speed and change of price movements, indicating overbought or oversold conditions.
- Stochastic Oscillator: This indicator compares a security's closing price to its price range over a specified time period, helping traders predict potential trend reversals.
3. Volume-Based Indicators:
- On-Balance Volume (OBV): OBV measures buying and selling pressure by adding volume on up days and subtracting it on down days, providing insight into the strength of a price trend.
- Accumulation/Distribution Line: This indicator combines price and volume data to assess whether a security is being accumulated (bought) or distributed (sold) by investors.
4. Volatility Indicators:
- Average True Range (ATR): ATR measures market volatility by calculating the average range between high and low prices over a specific period, helping traders set stop-loss levels and gauge potential price movements.
5. Sentiment Indicators:
- Put/Call Ratio: This ratio compares the number of put options (bearish bets) to call options (bullish bets), providing insights into market sentiment and potential shifts in investor expectations.
6. Oscillators:
- CCI (Commodity Channel Index): CCI measures a security's deviation from its statistical average, indicating overbought or oversold conditions.
- Williams %R: This oscillator measures where the current price stands in relation to its high-low range over a specified period, identifying potential trend reversals.
Importance of Indicators:
- Decision Making: Indicators help traders identify entry and exit points, confirm trends, and manage risk effectively.
- Market Analysis: By using indicators, traders gain insights into market dynamics, sentiment shifts, and potential price movements.
- Strategy Development: Indicators are integral to developing trading strategies based on technical analysis, complementing fundamental analysis.
Considerations:
- Combination: Traders often use multiple indicators in combination to validate signals and reduce false positives.
- Adaptability: Different indicators work better in various market conditions, and their parameters may need adjustment over time to remain effective.
Commonly Used Indicators in Financial Markets
Each of these indicators has specific characteristics and is used by traders and analysts to assess market trends, volatility, momentum, and sentiment. Traders often combine multiple indicators to form comprehensive trading strategies based on technical analysis and market conditions.